| 1. | Click Screen Distribution beside Activity on the Production Analysis screen. |
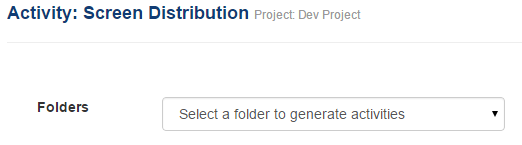
| 2. | Select the activity folder you wish to analyze from the drop-down list. |
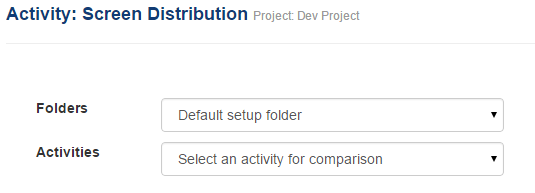
| 3. | Select the activity you wish to analyze from the drop-down list. An Activity: Screen Distribution window will appear that displays the various screen styles used in the project. Their use is shown as a bar graph, expressed as a percentage (%) and identified by the number of times each screen style is used. A screen distribution summary for the activity is provided at the bottom of the screen. |
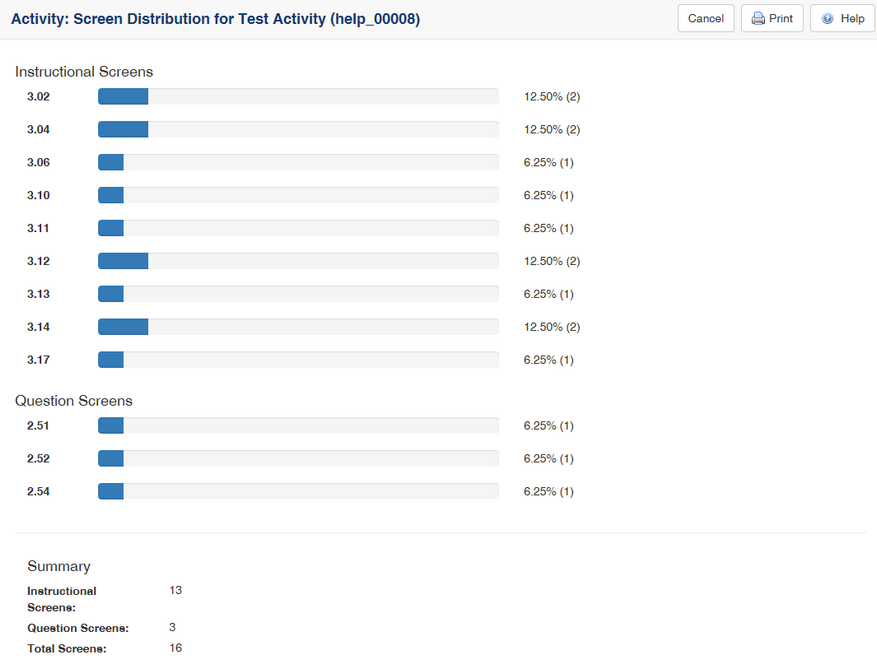
| 4. | To return to the Production Analysis screen, click the Cancel button in the top right corner or use the Browser's back button. There is also a Print button located here. |
|