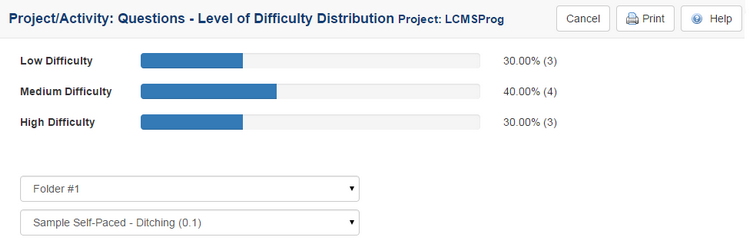
| 1. | Click Questions - Level of Difficulty Distribution beside Project/Activity on the Production Analysis screen. A screen will appear, indicating the distribution of questions with low, medium or high difficulty ratings for a specific project. Their use is shown as a bar graph, expressed as a percentage (%) and identified by the number of times each screen style is used. |
| 2. | To further refine your analysis, select an activity folder from the drop-down list, then select an activity from the next drop-down list. Results will be displayed on the Difficulty Distribution window. |
| 3. | To return to the previous screen, click the Browser Back button or Cancel. |
|