|
Several question-screen styles are based on the basic multiple-choice question (2.52) style, but introduce graphics, video or an alternative layout.
Thumbnail
|
Description
|

|
2.54 Multiple-choice with Graphic Options. User clicks on one or more media assets for single-response or multiple-response questions (static graphic only)
|

|
2.55 Multiple-choice with Hotspots. User clicks on one or more hotspots superimposed on media assets for single-response or multiple-response questions (static graphic only)
|
Screen style 2.54 is also similar to 2.52 except that it replaces the Text Options with a Graphics tab. This enables the developer to select up to nine graphic files as possible answers to the question. Users click an image to answer the question. Individualized feedback may be entered for each Graphic. To provide more tailored feedback for each question response, click the Feedback icon and enter the corresponding feedback. In Test Activities, if partial scoring is enabled in the Other Details tab, weighted values may be entered in the Weighted Value fields. Partial scoring can be used to calculate the final mark of a test. Note: If you wish to have the same caption for all the images on this screen, click the Apply to all Graphics checkbox in the Graphic 1 Caption field.
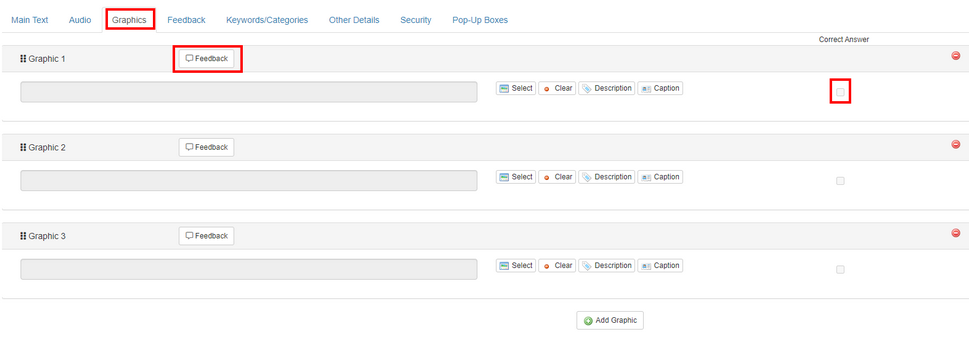
The correct answer is indicated by selecting one or more checkboxes beside the corresponding Graphic fields.
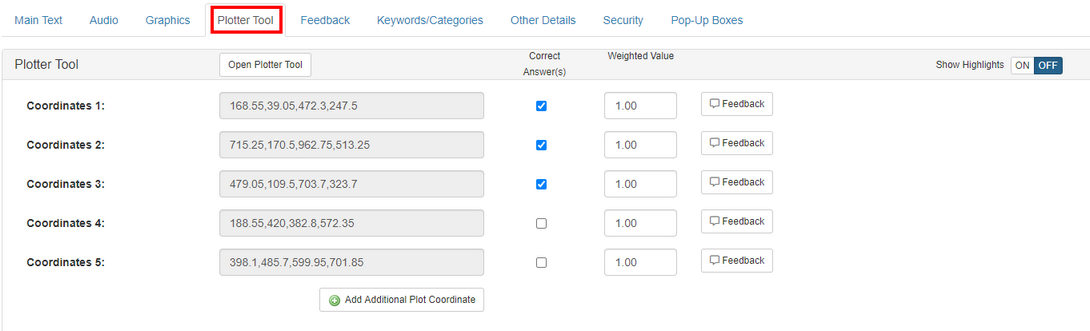
Screen style 2.55 is similar to 2.52 except that in addition to the Graphics tab, which allows the developer to select a single Default Graphic, it also has a Plotter Tool tab. This enables the developer to map plot areas for hot spots on the Default Graphic, which the user can click on in the viewer in response to the question. One or more hot spots can be selected by selecting the Correct Answer(s) checkboxes. The user can select multiple hot spots in the viewer by clicking on them. Allows selection between these layouts: "40% Text, 60% Media", "50% Text, 50% Media", "60% Text, 40% Media", "Text, Auto Media", "Text, Max 1/2 Media" or "Text, Max 2/3 Media".
| 1. | Click the Plotter Tool tab to open a pop-up containing the Default Graphic, in which you can plot up to nine areas of the image, depending on how many Text Option fields have been added. Note: See The Plotter Tool for more information on this feature. |
| 2. | Select the number of the set of coordinates (1-9) from the drop-down in the control panel and drag the mouse to define a rectangular area on the Default Graphic. |
| 3. | When you click Save, the coordinates of areas plotted in this way will be automatically saved into the corresponding Coordinates fields of the Plotter Tool tab. If you do not wish for the plotted areas to be visible to users in the viewer, ensure the Show Highlights toggle is OFF. By default, plotted areas will be highlighted in the viewer. |
| 4. | Click the checklist buttons to the right of the Coordinates fields to indicate one or more Correct Answer(s) for this question. |
| 5. | Click the Feedback icons to the right of the Coordinates fields to provide individualized, tailored feedback for each incorrect response to the question. |
| 6. | Enter a value in the Weighted Value fields (Test Activity only), if required. Note: Partial scoring must be enabled in Other Details tab. |
|