|
The following steps describe how to edit a shape once it has been drawn, and how to associate it with a Text Option.
| 1. | Click the Select button to change the mouse function to select (hand symbol). |
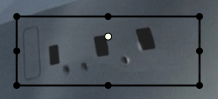
| 2. | Click the shape you want to edit. You will see a black outline box appear on the shape with black drag points in the corners and on the sides. |
| 3. | To resize a shape, click the drag points and drag them to the desired size. |
| 4. | To rotate a shape, click the white circle and move the mouse to rotate. Note: You may also rotate a shape using the keyboard shortcuts Shift + ß to rotate counterclockwise and Shift + à to rotate clockwise. |
| 5. | To copy and paste a selected shape, select CTRL+C to copy, then CTRL+V to paste or use the Copy and Paste buttons. |
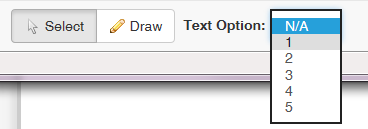
| 6. | To associate the shape with a Text Option, first ensure the shape is selected (click Select, then click the shape). Then, select a number from the Option drop-down for the associated Text Option. Note: There can be a one-to-one or many-to-one relationship between Text Options and shapes. |
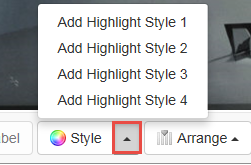
| 7. | To set the highlight for a shape to the style set for the viewer, click the arrow beside the Style button and click Add Highlight Style. For each interface, there are now predefined highlight styles to choose from based on project requirements. |
| 8. | To customize the highlight for a shape, click the Style button to open the Shape Styles dialogue box. Here you will find fields for line Color, Thickness and Opacity and background Color and Opacity. |
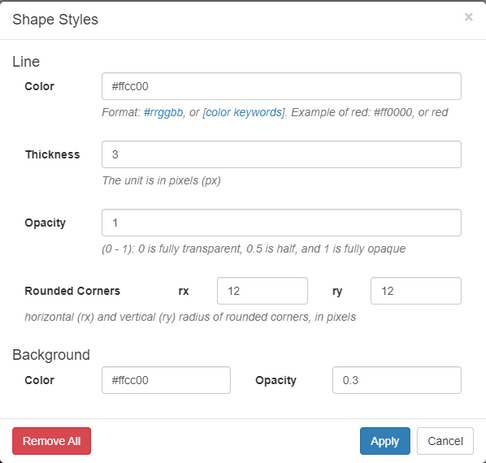
| 9. | Under Line settings, enter a hexadecimal value for the line Color, a value in pixels for the Thickness of the line, and a decimal value from 0 to 1 for Opacity. Note: The opacity of the line is usually less noticeable than the opacity of the background fill. Enter the values in pixels for the Rounded Corners rx and ry fields. Note: These fields only apply to the rectangle shape. |
| 10. | Under Background settings, enter a hexadecimal value for the fill Color, and a decimal value from 0 to 1 for the fill Opacity. Note: Opacity of 1 is totally opaque, opacity of 0 is totally transparent, and anything between is partially opaque. A value of roughly 0.2 (20% opacity) will allow you to highlight an area but still see the image in the background. |
| 11. | The Remove All button will remove any custom highlights and return the shape to the highlight style set by the viewer (only if you have previously added a highlight style by clicking Add Highlight Style). If you have not added a highlight style (by clicking Add Highlight Style), then clicking Remove All will make the shape solid and black. |
| 12. | Click the Apply button to save your settings or the Cancel button to exit without saving. You will return to the previous screen in the Plotter Tool window. |
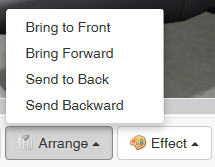
| 13. | Click the Arrange button to bring up a menu that will allow you to send a shape backward/forward or to the front or back. |
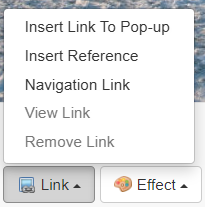
| 14. | Click the Link button to bring up a menu that will allow you to add a hyperlink to a pop-up or reference. You will be able to view and/or remove the hyperlink. This feature also enables you to set user navigation. On the Navigation Link window you may set the coordinates to navigate to a specific screen in a topic. You may also set the navigation to the Next Screen, Previous Screen, Next Item or Previous Item. Note: The Next Item and Previous Item options are only available for the 3.19 screen style. |
| 15. | Click the Effect button to toggle a drop shadow on or off. To delete a selected shape, click the Delete button. |
| 16. | When you have finished editing your shapes within the Plotter Tool window, click the Save button to save your changes, Save & Exit button to save the changes and exit the Plotter Tool, or close the window to exit without saving. Note: You may also undo/redo (Ctrl+Z or Ctrl+Y), copy and paste the shape using the Undo/Redo, Copy and Paste buttons. Click the corresponding up arrow beside the delete, copy and paste buttons to delete, copy or paste all the shapes. You may also move multiple shapes together by holding the left Ctrl key on the keyboard and selecting the desired shapes to move. |
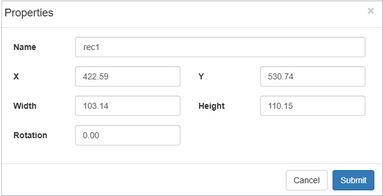
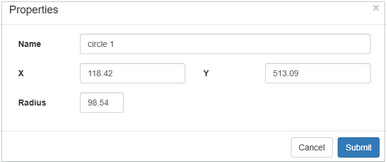
| 17. | With a shape selected, click the Properties button to open the Properties window and display the shapes's (Name, X, Y, Width, Height and Rotation) or (Line Plot and Rotation) properties. Note: The properties displayed are shape specific (e.g, Circles will display the Name, X, Y and Radius properties). |
| 18. | Edit the desired property(ies), click the Submit button to save the changes. Note: The shape will change based on the newly entered properties. |
|